 Kantyra
Kantyra
Kantyra
Alain Rees · 12-07-2026 · 9 min leestijd
As a CISO and as a CISO Office you want to know where you stand, both at the level of the organisation and at that of your own function. Reporting to the board is a consequence of that, not a starting point. The real goal is to measure enough to be able to steer and adjust in time. This article explains how you do that with indicators, how you distinguish between performing and meeting goals, and how you measure on two levels without drowning in figures.
In short
- You measure not to report, but to be able to steer and adjust in time.
- A performance indicator (KPI) shows how you perform, a goal indicator (KGI) shows whether you meet the goal.
- You measure on two levels: the organisation and the CISO Office.
- Every indicator has a target and a direction, and periodic measurements give the trend and a traffic light.
- Start with manual measurements that work for every topic, and automate later where you can.
Many organisations do report on information security, but measure too little to really steer by it. A report tells you afterwards what happened, while good measurements let you adjust along the way. That difference is large. A board that receives a report each quarter knows how things stood, but a CISO who follows the trend sees a goal slipping out of reach and can still do something about it.
Measuring therefore serves above all your own steering. The report to the board follows from it by itself, because if you measure the right things, you already have the story for the board.
To be able to steer, you use two kinds of indicator that complement each other.
A performance indicator, the KPI, shows how well you perform on the way to a goal. The average remediation time of critical vulnerabilities is such an indicator, because it tells you how fast you work.
A goal indicator, the KGI, shows whether you actually meet the goal. The percentage of critical vulnerabilities remediated within the agreed deadline is such an indicator, because it tells you whether you meet the standard you set yourself.
The two belong together. The KPI steers your daily work, the KGI guards whether that work leads to the desired result. Together they prevent you from working hard without meeting your goal, or meeting your goal without knowing how.
Where you stand is a question on two levels, and you measure them both.
The organisation's perspective shows how the organisation is doing on security. Think of the vulnerabilities remediated on time, the incidents reported in time and the continuity plans that have been tested.
The CISO Office's perspective shows how your own function performs in steering and monitoring that. Think of the assessments reviewed on time, the registers that are current and the report that reaches the board on time.
These two can diverge. The organisation may be doing well while the CISO Office is behind, or the other way around. By measuring both, you keep sight of the blind spot that arises when you look at only one level.
A usable indicator is more than a number. Per indicator you record a number of properties:
With these properties an indicator becomes readable on its own. Anyone sees at a glance what is measured, what the goal is and who is responsible.
An indicator comes to life through measuring. Periodically you record a value, with the date, the number and a short note. From that series of measurements the trend and the current value follow by themselves.
The comparison with the target then gives a traffic light. If the value is at or above the target, the indicator is on track and turns green. If it is just below, it needs attention and turns amber. If it lags, it turns red. This way you see at a glance where things are going well and where you must intervene, without first having to dissect a table.
The note with each measurement matters more than it seems. It explains an outlier, records an assumption and makes the measurement traceable later.
When measuring, it pays to start practically. Manual periodic measurements form the best basis, because they work for every topic. Even an indicator like the phishing reporting rate, which comes from your awareness platform, you record this way easily.
Some of the indicators you can later feed automatically from data you already have. Think of the average remediation time, the number of risks above the tolerance, the deadlines from NIS2, the review dates of your registers and the implementation level of your Statement of Applicability. That is a sensible next step, though not a precondition to begin.
Wanting to measure every indicator automatically is a pitfall. It would require an enormous and partly impossible build, while a manual measurement per quarter often tells you exactly enough to steer. So start manually, and automate selectively where it really saves time.
When you measure, two kinds of overview arise that complement each other.
For your own steering you use a scorecard: an overview with, per indicator, the traffic light and a mini trend, grouped by perspective and by topic. That scorecard is your working instrument, with which you see in a single picture where you stand and where you must adjust.
For the board you summarise this in a block with performance and goal indicators in the regular management report. The board does not need to see every indicator, but wants the state in broad lines, the trend and the points that need attention. This way measuring stays close to the goal: it is the bridge between your daily steering and your accountability to the board.
Indicators belong in the base of your management system, in every plan, because it is board and management information, just like the management report itself. Their management sits with the managers and administrators who also manage the underlying topics, so the indicator stays close to the source.
This way measuring connects directly to your information security and risk management (ISMS) and to topics like vulnerability management. The indicators form the steering layer above the rest of your system of control, instead of a loose collection of figures.
The examples below help you on your way. Choose a small number of them, because a few indicators you really maintain beat a long list that fades.
Organisation, how is the organisation doing
| Topic | Indicator | Type | Target |
|---|---|---|---|
| Vulnerabilities | Critical vulnerabilities remediated within the deadline | KGI | ≥ 95% |
| Vulnerabilities | Average remediation time of critical vulnerabilities | KPI | ≤ 14 days |
| Risk management | Top risks with a current treatment plan | KGI | 100% |
| Risk management | Risks above the tolerance without acceptance | KPI | 0 |
| Incidents | Reportable incidents reported within 72 hours | KGI | 100% |
| Incidents | Average lead time from incident to resolved | KPI | falling |
| Privacy | Processing activities with a valid basis and a current review | KGI | 100% |
| Continuity | Continuity plans tested in the past year | KPI | 100% |
| Compliance | Implementation level of the Statement of Applicability | KGI | rising |
| Awareness | Phishing reporting rate | KPI | rising |
CISO Office, how is the CISO doing
| Indicator | Type | Target |
|---|---|---|
| Assessments reviewed within the deadline under the four-eyes principle | KPI | ≥ 90% |
| Risks with an assigned owner and handler | KGI | 100% |
| Registers within their review date (risks, documents, processing activities) | KPI | ≥ 95% |
| Overdue tasks in the CISO Office | KPI | falling |
| Controls tested for effectiveness on time | KPI | ≥ 90% |
| Quarterly report to the board delivered on time | KGI | yes |
What is the difference between a KPI and a KGI? A performance indicator (KPI) shows how well you perform, for instance the average remediation time. A goal indicator (KGI) shows whether you meet the goal, for instance the percentage remediated within the deadline. The KPI steers the work, the KGI guards the result.
Why do you measure on two levels? Because the organisation and the CISO Office can diverge. The organisation may perform well while your own function is behind, or the other way around. By measuring both, you keep sight of the whole.
Do you have to measure everything automatically? No. Manual periodic measurements work for every topic and are a good basis. Some you can later feed automatically from data you already have, although automating everything is unnecessary and partly impossible.
How often should you measure? For most indicators a measurement per quarter is enough to steer, in step with your management report. For fast-moving topics you can measure more often.
What is a good target? A target is achievable but ambitious, and fits your risk appetite. Also give a direction, so it is clear whether a higher or a lower value is better.
In Kantyra you do this with one generic building block, the indicator, that works for every topic. You choose per indicator the type, the topic and the perspective, you record the unit, the target and the direction, and you assign an owner. You then record a measurement periodically, after which the trend, the current value and the traffic light arise by themselves. To help you on your way, you can choose an indicator from a supplied list of examples.
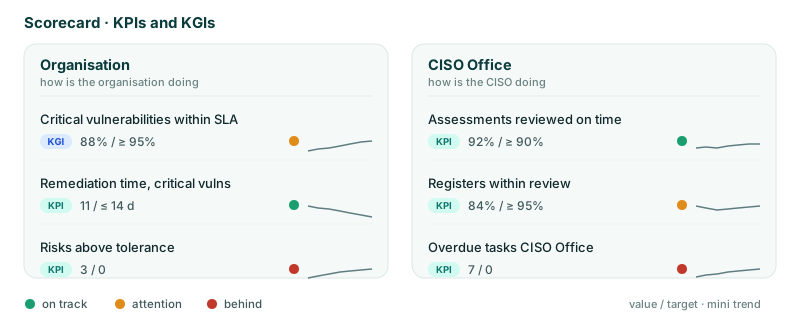
For your own steering you see everything on a scorecard with traffic lights and mini trends, grouped by perspective and by topic. For the board it comes together in a block with performance and goal indicators in the management report. This way you measure where you stand, steer in time and account to the board, all within your ISMS. Request a demo and discover how to steer your information security with indicators.
Kantyra is a Dutch ISMS and GRC platform that lets organisations manage their information security, risk management and compliance demonstrably, in line with standards such as ISO 27001 and ISO 22301 and with legislation such as the GDPR, NIS2 and the AI Act.
In een demo van 30 minuten lopen we het model door aan de hand van jouw situatie.
Plan een demoVulnerability management is steering, not scanning. From a CISO perspective, this article shows how you govern rather than execute: with policy, risk-based prioritisation, remediation deadlines, steering metrics and accountability to the board, and how that coincides with the four phases of the Kantyra model.
A one-off pentest produces a report, but only a structured approach delivers value. This article covers the pentest policy, the pentest calendar, the report and the follow-up, and shows why a pentest is above all a signal that must run through the four phases of the Kantyra model.
The GDPR sets rules for processing personal data and revolves around one core idea: accountability. This article covers the core principles, the six legal bases, the rights of data subjects and the data breach notification duty, and shows how compliance coincides with the four phases of the Kantyra model.